
This report is intended to provide insight about how to use R to perform ANOVA analysis for marketing campaign. In this report, objective is to analyse promotion Campaign data set (“PL_X_SELL”) in R programming language and generate information about the data set. This data exploration report will contain following:
- Problem Description
- Importing the dataset using R
- Identify the dependent variable & independent
- Summary statistics & inferences
- Tests for testing normality & homogeneity
- ANOVA Analysis (one way & two-way anova)
- Post Hoc Test
- Interpretation of results
Assumptions
- The groups or categories under the treatment variable are independent of each other
- The groups are homogeneous (similar in every manner) except for the case of treatment
- The response (dependent) variable is normally distributed within each of the categories defined by the treatment variable
Exploratory Data Analysis – Step by step approach
A Typical Data exploration activity consists of the following steps:
- Environment Set up and Data Import
- Problem Description
- Null Hypothesis & Alternative Hypothesis
- Variable Identification & Descriptive statistics
- Test of Assumptions
- ANOVA Analysis (one way & two-way anova)
We shall follow these steps in exploring the provided data set
Environment Set up and Data Import
Install necessary Packages and Invoke Libraries
Use this section to install necessary packages and invoke associated libraries. Having all the packages at the same places increases code readability.
| Package Name | Description |
| CSV | Read and write CSV Files with selected conventions |
| Psych | Procedures for Psychological, Psychometric, and Personality Research |
| Car | Companion to Applied Regression |
| Foreign | Read Data Stored by ‘Minitab’, ‘S’, ‘SAS’, ‘SPSS’, ‘Stata’, ‘Systat’, ‘Weka’, ‘dBase’, … |
| MASS | Support Functions and Datasets for Variables and Ripley’s MASS |
| robustHD | Robust Methods for High-Dimensional Data |
| rcompanion | Functions to Support Extension Education Program Evaluation |
| WRS2 | A Collection of Robust Statistical Methods |
| tabplot | For visualizing large dataset |
| tidyverse | tidyverse is a collection of R packages designed for data science |
| dplyr | It is used for subset selection and applying actions on the datasets like applying filter, reorder etc. |
| ggplot2 | It is used for creating attractive graphics in R |
| readxl | Used to read excel files in R |
| nlme | Fit and compare Gaussian linear and nonlinear mixed-effects models. |
| onewaytests | Performs one-way tests in independent groups designs, pairwise comparisons, graphical approaches, assesses variance homogeneity and . |
Set up working Directory
Setting a working directory on starting of the R session makes importing and exporting data files and code files easier. Basically, working directory is the location/ folder on the PC where you have the data, codes etc. related to the project.
Please refer to Appendix A for Source Code for more details on how to set working directory in R.
Import and Read the Data set
The given data set is in .csv format. Hence, the command ‘read.csv’ is used for importing the file.
Problem Description
- To Conduct a one-way ANOVA analysis to study whether occupation of the account holder affects quarterly average balance in the account
- To Conduct two-way ANOVA analysis on gender and occupation on quarterly average balance.
Variable Identification & Descriptive Statistics
- As per the data the independent Variable (Factor Variable) is “Occupation” and the Dependent Variable is “Balance”
- Load all the libraries
library(tidyverse)
library(dplyr)
library(ggplot2)
library(readxl)
library(psych)
library(car)
library(foreign)
library(nlme)
library(onewaytests)
library(tabplot)
- Load the data and run str commands to learn more about the data. It shows that there are 20000 observations with 10 variables, where Cust_ID, Gender, Occupation, AGE_BKT are factor variables, Target, Age, No_of_CR_TXNS, SCR, Holding period are integers and Balance is number variable respectively
plxsell <- read.csv("PL_X_SELL.csv")


class(plxsell)

View(plxsell)

str(plxsell)
'data.frame': 20000 obs. of 10 variables: $ Cust_ID : Factor w/ 20000 levels "C1","C10","C100",..: 1 2 3 4 5 6 7 8 9 10 ... $ Target : int 0 1 0 0 0 0 0 0 0 0 ... $ Age : int 30 41 49 49 43 30 43 53 45 37 ... $ Gender : Factor w/ 3 levels "F","M","O": 2 2 1 2 2 2 2 2 2 2 ... $ Balance : num 160379 84371 60849 10559 97100 ... $ Occupation : Factor w/ 4 levels "PROF","SAL","SELF-EMP",..: 2 3 1 2 4 2 1 2 1 1 ... $ No_OF_CR_TXNS : int 2 14 49 23 3 2 23 45 3 33 ... $ AGE_BKT : Factor w/ 7 levels "<25",">50","26-30",..: 3 6 7 7 6 3 6 2 6 5 ... $ SCR : int 826 843 328 619 397 781 354 239 339 535 ... $ Holding_Period: int 9 9 26 19 8 11 12 5 13 9 ...
- Run summary command to know the Mean, Median, range, min, max value of different variables
summary(plxsell)
Cust_ID          Target             Age       Gender
##  C1     :    1   Min.   :0.00000   Min.   :21.0   F: 5525
##  C10    :    1   1st Qu.:0.00000   1st Qu.:30.0   M:14279
##  C100   :    1   Median :0.00000   Median :38.0   O:  196
##  C1000  :    1   Mean   :0.08665   Mean   :38.4
##  C10000 :    1   3rd Qu.:0.00000   3rd Qu.:47.0
##  C10001 :    1   Max.   :1.00000   Max.   :55.0
##  (Other):19994
##     Balance           Occupation   No_OF_CR_TXNS    AGE_BKT
##  Min.   :      0   PROF    :5463   Min.   : 0.00   <25  :1784
##  1st Qu.:  23737   SAL     :5839   1st Qu.: 7.00   >50  :3020
##  Median :  79756   SELF-EMP:3366   Median :13.00   26-30:3404
##  Mean   : 146181   SENP    :5332   Mean   :16.65   31-35:3488
##  3rd Qu.: 217311                   3rd Qu.:22.00   36-40:2756
##  Max.   :1246967                   Max.   :50.00   41-45:3016
##                                                    46-50:2532
##       SCR        Holding_Period
##  Min.   :100.0   Min.   : 1.00
##  1st Qu.:333.0   1st Qu.: 8.00
##  Median :560.0   Median :16.00
##  Mean   :557.1   Mean   :15.34
##  3rd Qu.:784.0   3rd Qu.:23.00
##  Max.   :999.0   Max.   :31.00
##
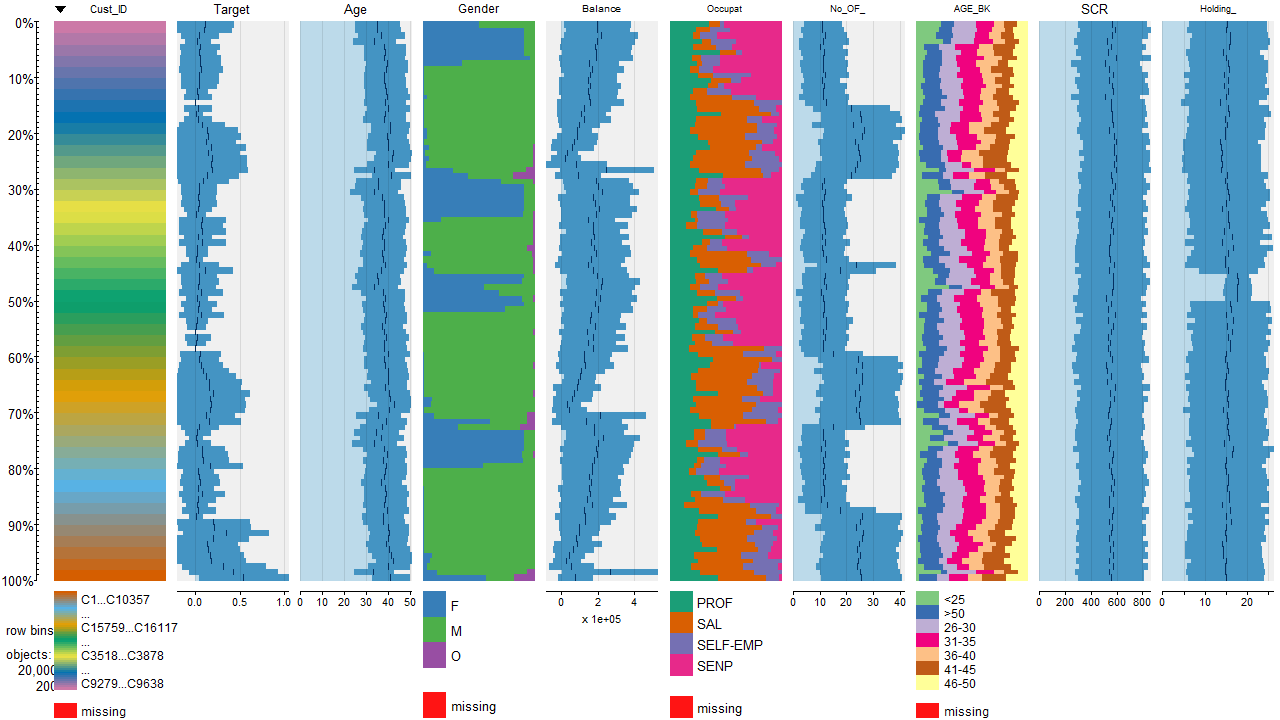
- Using table plot from tabplot to visualize entire dataset- tableplot(plxsell)
- visualization with boxplot using ggplot2, it shows the variation between groups
ggplot(data = plxsell,aes(y=plxsell$Balance, x=plxsell$Occupation)) +geom_boxplot(aes(col=Occupation))+labs(title="Boxplot of Balance for all occupation types")

Null & Alternative Hypothesis
Null Hypothesis (H0): µ of all occupations is equal (i.e.,Mean of Prof, SAL, Self-emp and SENP are same)
Alternative Hypothesis (HA): µ of all occupations is not equal i.e., at least one of the means is different from the rest.
Test of Assumptions
- The groups or categories under the treatment variable are independent of each other
- The groups are homogeneous (similar in every manner) except for the case of treatment
- The response (dependent) variable is normally distributed within each of the categories defined by the treatment variable
Normality is tested by Shapiro test. First create a subset with 5000 rows and then apply shapiro test.
fivethd <- plxsell[1:5000,]

fivethd$Occupation<-factor(fivethd$Occupation,labels = c("PROF","SAL","SELF-EMP","SENP"))
cat("Normality p-values by Factor place: ")
for(i in unique(factor(fivethd$Occupation))){
  cat(shapiro.test(fivethd[fivethd$Occupation==i, ]$Balance)$p.value," ")
}
> 3.667788e-46 4.055147e-35 9.668104e-42 1.004125e-31
- Since P Values are greater than 0.05 that implies the Normality has not been violated
- Homogeneity in variance across the categories in the factor variable is tested by levene Test & Bartlett Test.
Based on the Homogeneous of variance test using levene & Bartlett method, P-Value is less than 0.05 therefore null hypothesis is rejected i.e., the variations are not homogeneous across occupations
Levene Test in R
leveneTest(plxsell$Balance ~ plxsell$Occupation, data = plxsell)
## Levene's Test for Homogeneity of Variance (center = median)
##          Df F value    Pr(>F)
## group     3  54.545 < 2.2e-16 ***
##       19996
## ---
## Signif. codes:  0 '***' 0.001 '**' 0.01 '*' 0.05 '.' 0.1 ' ' 1
Bartlett test in R
bartlett.test(plxsell$Balance ~ plxsell$Occupation)
##
##  Bartlett test of homogeneity of variances
##
## data:  plxsell$Balance by plxsell$Occupation
## Bartlett's K-squared = 96.401, df = 3, p-value < 2.2e-16
ANOVA Analysis -One-Way ANOVA in R
Problem– one-way ANOVA analysis to study whether occupation of the account holder affects quarterly average balance in the account.
Inference– Anova analysis shows that F statistic is highly significant therefore the occupation of the account holder do not affect the quarterly average balance.
anova_Model <- aov(plxsell$Balance ~ plxsell$Occupation, data = plxsell)

summary(anova_Model)
Df    Sum Sq   Mean Sq F value Pr(>F)
## plxsell$Occupation     3 1.052e+13 3.506e+12   123.8 <2e-16 ***
## Residuals          19996 5.662e+14 2.831e+10
## ---
## Signif. codes:  0 '***' 0.001 '**' 0.01 '*' 0.05 '.' 0.1 ' ' 1
Post – Hoc Test
tukey_HSD <- TukeyHSD(anova_Model)

tukey_HSD
##   Tukey multiple comparisons of means
##     95% family-wise confidence level
##
## Fit: aov(formula = plxsell$Balance ~ plxsell$Occupation, data = plxsell)
##
## $`plxsell$Occupation`
##                     diff        lwr        upr     p adj
## SAL-PROF      -23151.230 -31288.977 -15013.482 0.0000000
## SELF-EMP-PROF -18592.178 -28065.330  -9119.026 0.0000028
## SENP-PROF      34199.915  25877.257  42522.573 0.0000000
## SELF-EMP-SAL    4559.052  -4797.095  13915.198 0.5936835
## SENP-SAL       57351.145  49161.914  65540.376 0.0000000
## SENP-SELF-EMP  52792.093  43274.678  62309.508 0.0000000
plot(tukey_HSD)

- The above Post-Hoc Test shows that multiple comparison of means that implies each of the occupation are different from the avg balance based on the p adjusted value
- Tukey signifies that the differences across the occupation are all significant
How To Conduct Two Way Anova Analysis in R
Problem- Conduct two-way ANOVA analysis on gender and occupation on quarterly average balance.
- Two way ANOVA analysis used for more than one factor.
- In this case, we have occupation & gender.
- We have four categories in occupation and two categories in Gender
- The effects that needs to be considered are
- Direct effect from Occupation
- Direct effect from Gender
- The interaction effect of occupation and the gender
- Process remains same
- Male has high mean occupation category compared to the Female and Org
tapply(plxsell$Balance,list(plxsell$Occupation,plxsell$Gender), mean)
F        M         O
PROF     194154.4 129761.6  69081.36
SAL      174860.4 116906.7 139669.79
SELF-EMP 184217.4 108727.4 111960.16
SENP     210156.0 156289.2        NA
- Now same test for standard deviation reveals that Org has high SD in SAL & SELF-EMP occupation category compared to the Female and male
tapply(plxsell$Balance,list(plxsell$Occupation,plxsell$Gender), sd)
F        M        O
PROF     186560.2 164560.0 147598.3
SAL      198516.3 152463.1 224833.8
SELF-EMP 188517.8 138033.2 225062.5
SENP     193518.9 158528.5       NA
- Now plot interaction plot. This reveals that Male has higher mean & earnings in occupation category compared to the Female and Org
interaction.plot(plxsell$Gender,plxsell$Occupation,plxsell$Balance)

Test of Assumptions
- Normality Assumption is violated
- The homogeneous variance across the groups is also violated.
- F-statistic of the ANOVA does not get affected by much if there is balanced data.
Two Way Anova Analysis
- Two way Anova analysis shows that F statistic is highly significant
anova2<-aov(Balance~Occupation+Gender+Occupation:Gender,data = plxsell)
summary(anova2)
Df    Sum Sq   Mean Sq F value  Pr(>F)
Occupation            3 1.052e+13 3.506e+12 127.035 < 2e-16 ***
Gender                2 1.401e+13 7.004e+12 253.797 < 2e-16 ***
Occupation:Gender     5 5.145e+11 1.029e+11   3.729 0.00225 **
Residuals         19989 5.517e+14 2.760e+10
---
Signif. codes:  0 ‘***’ 0.001 ‘**’ 0.01 ‘*’ 0.05 ‘.’ 0.1 ‘ ’ 1
Robust Methods One-Way ANOVA
oneway.test(plxsell$Balance~plxsell$Occupation,var.equal = FALSE)
One-way analysis of means (not assuming equal variances)

data:  plxsell$Balance and plxsell$Occupation
F = 120.18, num df = 3, denom df = 10305, p-value < 2.2e-16
model1<-aov(plxsell$Balance~plxsell$Occupation)
anova(lm(plxsell$Balance ~ plxsell$Occupation))
Analysis of Variance Table

Response: plxsell$Balance
                      Df     Sum Sq    Mean Sq F value    Pr(>F)
plxsell$Occupation     3 1.0518e+13 3.5059e+12  123.82 < 2.2e-16 ***
Residuals          19996 5.6618e+14 2.8315e+10
---
Signif. codes:  0 ‘***’ 0.001 ‘**’ 0.01 ‘*’ 0.05 ‘.’ 0.1 ‘ ’ 1
Robust Methods, Two-way ANOVA
p.value
Occupation            	0
Gender                	0
Occupation: Gender    	0
- The results of both one-way and two-way ANOVA are robust to violations of assumptions as the p-values for both occupation and gender are closer to zero.
The post How to Perform ANOVA analysis in R for Marketing appeared first on Business Analysis & Data Science.